This time the goal is to make an analog clock tick.
Again, most of the HTML+CSS is there provided by Wes and I only need to add the “ticking” JS code. The “trick” is to keep applying a CSS transformation to the hands by setting the rotation angle.
What I learned in this course:
CSS transform-origin to position the point where the CSS transformation will apply
CSS transition-timing-function for how the transition should play out
The cubic bezier editor in Chrome’s developer tools! Look at that!
JS’s element.style.transform is not a function so, no .transform(rotate(...)). I intuitively tried to use it as a function, not sure why.
and oh, yeah, forgot to mention the backticks in episode 1. Cool way to embed variables in strings and have them be expanded!
K, this was a quick one but fun anyway. Stay tuned!
A few designer friends over at Automattic gathered up to take the JavaScript30 class by Wes Bos (check it out, it’s free!). Thought I should join them. I’ve been itching to take on some modern JS class but never gathered the will/patience/time to do it. This one seems like a sweet deal so, I signed up!
To make the commitment a little more, well, official, I decided to document my findings throughout the courses so, here I am!
First course was about wiring up a Drum Kit in JS. Starter files had the HTML+CSS ready and I just needed to add the JS6 code. Every time a key is hit, the drum kit will play the corresponding sound (say clap, hihat, kick, etc) while doing a small animation of the key on-screen to show which one got hit. Neat!
So, here’s what Ilearned from the first course called Drum Kit:
data- attributes
attribute selectors
classList add/remove/toggle!
arrow function (=>)
listening for the transitionend event
It’s been some time since I tinkered with JavaScript and it’s clear that the language has really evolved with JS6. Makes it taking the next courses even more interesting. I’ll let you know!
I recently wanted to install the excellent Vysor extension/app in Chrome on my mid-2011 MacBook Air. But the extension was not installable… Instead of an `Add to Chrome` button, I was only given a `Not compatible` button! Clicking it was informing me that the app uses 3D graphics and needs WebGL
Strange. No WebGL enabled in my Chrome?
I tried checking he settings, quiting, reinstalling and even clearing Chrome’s application data folder to no avail.
As it happens, WebGL is by default disabled on my mac. The graphics card in it (Intel HD Graphics 3000) is blacklisted, even on the latest macOS Sierra!
Fortunately, and a few Google searches later, found the workaround in overriding the blacklisting by visiting the Chrome flags page and enabling the very first option: `Override software rendering list`. And it worked!
Trusted, overriding that setting is not exactly recommended so, I’ll keep an eye on the system’s stability and revert the tweak if it makes it too unstable. So far so good though 🙂
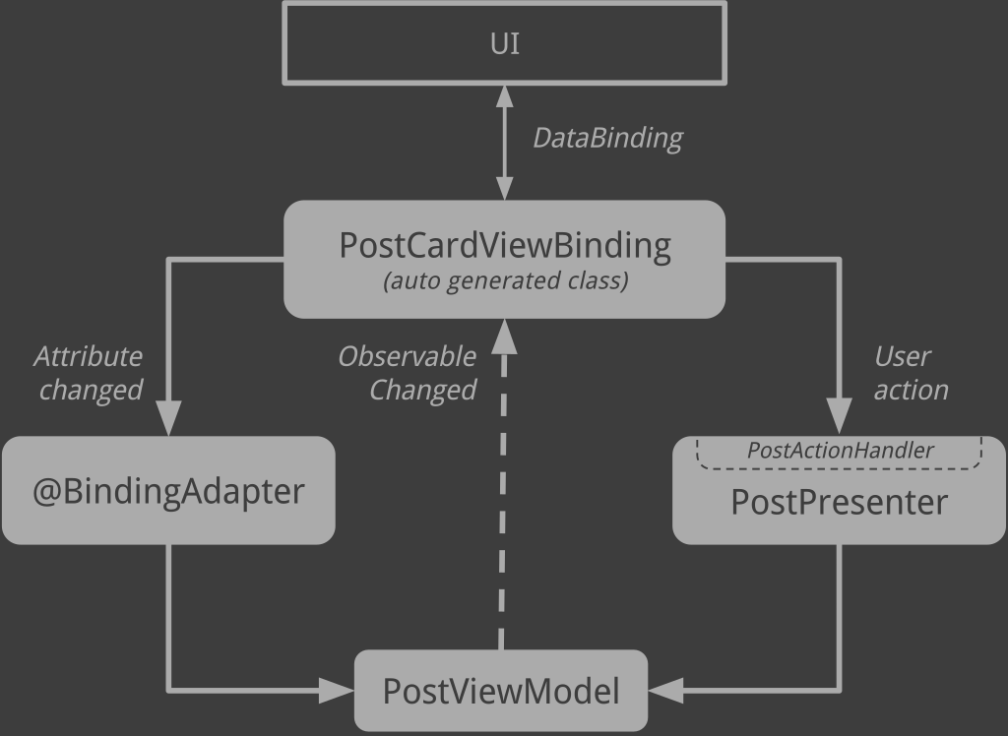
I wanted to play with the DataBinding library ever since Google introduced it back in 2015. I didn’t seem to find a good opportunity to try it though. The tutorials and introductions seemed interesting but rather trivial.
So, a couple of months ago I decided to just dive in. I picked up the WordPress Android app, on which I work daily anyway and just use DataBinding, somewhere. Being far from trivial, the WP app would serve as a good base to try the library on.
OK, I’m usually busy with a few things at the same time (being a father is also a thing, right?) and occasionally one of them matures enough to leave the nest and fly into the wild! Yoohoo!
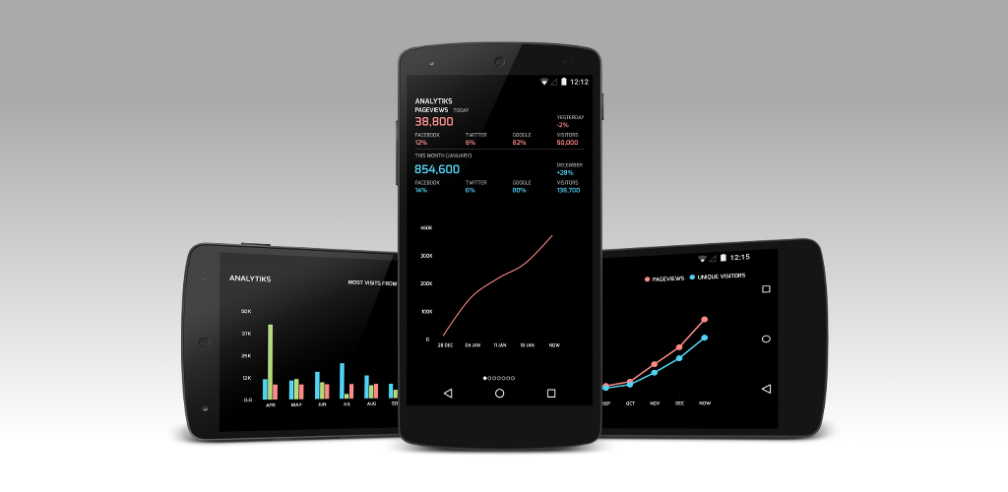
So without further ado, meet Analytiks for Google Analytics, the latest Android app crafted by my bare hands (well, plus keyboards)!
Analytiks for Google Analytiks Android app
The app is still in beta, but that doesn’t mean it’s crippled! The basic premise is to deliver a quick overview of how your websites perform, powered by the data collected through Google Analytics. For instance, are your pageviews better or worse than yesterday? What about this versus last month?
Bonus: Try to hold the device in landscape… more goodies wait you there 🙂
Analytiks is produced and published by Blatt Labs Inc. and it’s been some months now that we collaborated to put together the Android sibling of their successful iOS app. Yes, my dear iOS friends, make sure you head over to the AppStore and get Analytiks for iOS, thanks!
The app is actively supported and developed and more features will land, well, soon :P. In the meantime, enjoy the app and don’t be shy to rate and leave us a review on PlayStore 🙂
My obsession with collecting data from my surroundings is nothing new. I once set out to build a web service to collect all my purchases and produce charts I could draw budget conclusions from. Even though that project did its circle (not a particularly successful one), it just cannot get out of my mind and might be revived in some future 😉
This time around, my attention is at something more simple (hopefully): collecting power usage data at our home. Specifically, I wanted to start monitoring some of the major power consumption culprits, the washing machine and the tumble dryer.
My attitude has changed through the years: I now try to focus as much as possible to the area of the “problem”, the solution of which will bring in good value, fast. So, focusing only at the big white appliances that their usage can generally be optimized, such as the washer and the dryer. A counter example is the fridge… there isn’t much you can do to your habits to lower its consumption!
What went OK
The project basically started back in August 2014, when I created a Google Form to help me and my wife to easily log in the data.
Google Form for the washes input
The data was gathered by manually reading the display of the watt-meter I already had in my gadgetset:
The D02A watt-meter I had looked much like this one
The project was working perfectly. We were logging in the reading after every wash, zero the meter out and switch plugging in the dryer, let it do the drying circle and then log the reading in again. Life was good! After a couple of months, we already had a good picture of how we use those two appliances.
Reality check
And then disaster… the meter’s display stopped functioning 😦
We had to bring the project back to working condition though. Our usage pattern was about to change (a newborn child was just around the corner!) and the meter would help us re-optimize. I did replace the meter, going a step further this time:
The FHT-9998 wireless watt-meter
Yeap, I went wireless! I chose to pick up these 433MHz power monitors (with their including display unit) as I saw the opportunity to move away from the manual gathering of the readings and perhaps manage to do that automatically, using some form of receiver. A nice detail: the package already had 2 independent monitoring sockets included, so there was no need to switch which appliance was plugged it anymore.
And then reality kicked in… The baby joined us and every project of mine was put on hold, including resuming the consumption monitoring procedure. The baby arriving meant all our brainpower was focused on its well-being; we didn’t have the patience to put in the extra work of gathering the readings anymore!
A new solution had to be put in place, and the plausible alternative I could think of was to try that idea and do the data gathering automatically.
Stop thinking; start doing
So, here’s the plan:
Use my RaspberryPi, the nice chips of which are only collecting dust and cosmic radiation at the moment
Get a 433MHz receiver
Manage to pick up the signals emitted by the 2 watt-meters
The dongle is marketed as a DVB-T TV tuner but with Software Defined Radio (SDR) capabilities. The preliminary research I did showed that I will probably be able to setup the raspi to use the dongle and “wire” it through some software packages to decode the signals. Let’s see. This is me, trying to move the project one step further, even if that step will be an experiment.
So, after taking its time travelling the eastern oceans, my RTL2832U based DVB dongle finally arrived this week! Check the previous post for some background on what I have in mind for it 😉
In the short time with it, I only had partial success picking up the energy monitor sensor values. Some signal seems to picked up but can’t decode and ectract the values just yet. But, I did managed to have quite some fun with the RF temperature sensors I have lying around!
Here’s a nice shot of a little page I’ve put up, showing the temperature history at my balcony:
History of outside temperature at my balcony
Here’s the basic architecture of the setup:
The DVB dongle is plugged into a RasperryPi
The Raspi is connected to my LAN and runs the rtl_433 utility, modified by me to be able to decode the values of each sensor
When picked up, the temperature value gets submitted to a Google form, storing the value in a Google Sheet
In the Sheet, the history of temperatures is displayed on a chart
Bonus action: upon submitting a new value, a script in the Sheet sends an email to ifttt.com, activating a recipe that tweets the value! Check out the Twitter feed! The feed is rate-limited to roughly 1 tweet every 30mins.
I’ll go into more detail in some future posts, stay tuned 😉